Figures updated · Text reviewed · By the Riftrate team · How the index is built
What the long-run data shows
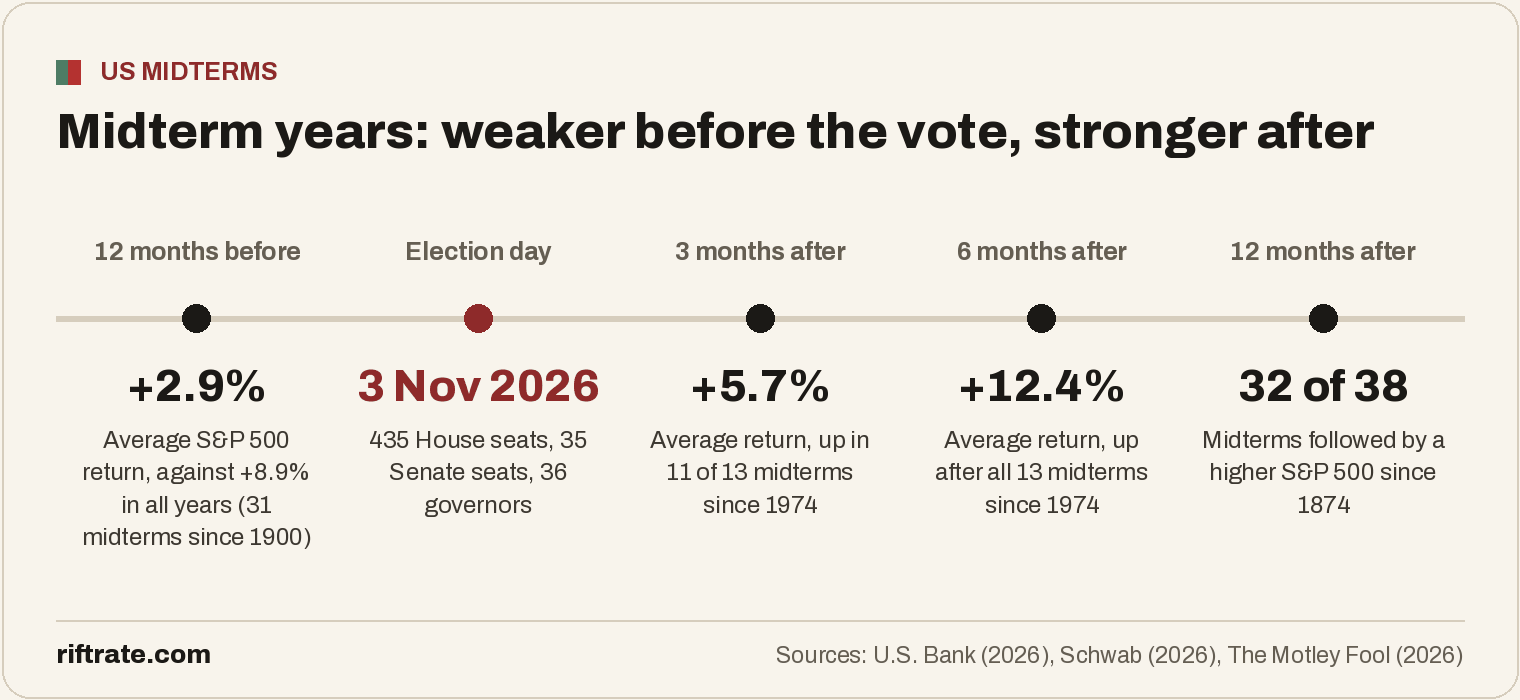
Three recent studies, using different periods and methods, point the same way: returns tend to be weak before a midterm and stronger after it.
| Study | Period | Finding |
|---|---|---|
| Charles Schwab Investment Management, August 2026 | 13 midterms since 1974, S&P 500 price return | Up in the 6 months after all 13 midterms, average +12.4%; up 3 months later in 11 of 13, average +5.7% |
| The Motley Fool, October 2026 | 38 midterms since 1874, Robert Shiller's data, total return | Higher 12 months later after 32 of 38 midterms (84%), average +14%; the last decline after a midterm was in 1930 |
| U.S. Bank Asset Management, October 2026 | 31 midterms, 1900 to 2025 | Average +12.4% in the 12 months after, +17.5% for midterms since 1980; average +2.9% in the 12 months before, against +8.9% in all years |
The same U.S. Bank study adds an important caveat: statistical tests did not establish a dependable midterm-election effect. A pattern that held in the past is not a law.
Why stocks often rise after a midterm
- Uncertainty ends. Before the vote, investors do not know which party will control Congress, so some wait. Once the result is known, part of that money goes back to work.
- Divided government limits big changes. Midterms often take seats from the president’s party. A Congress split between parties passes fewer major laws, which some investors read as fewer surprises on taxes and regulation. It can also raise the risk of standoffs over spending and the debt limit.
- The weak months come first. Midterm years have often seen soft markets before the vote, so part of the later gain is a rebound from a lower starting point.
None of these explains every year. The economy, interest rates and corporate earnings usually matter more to stocks than any election.
What markets did after the last US elections
Riftrate’s events library measures what markets did after each US election since 2018, from the last close before the vote. Stock-market stress and volatility come from the OFR Financial Stress Index: a fall means calmer markets, a rise means more stress.
| Date | Election | Stock-market stress, 5 sessions | Volatility, 5 sessions | US dollar, 5 sessions | US 10-year yield, 5 sessions | Stock-market stress, 20 sessions |
|---|---|---|---|---|---|---|
| 5 November 2024 | US presidential election 2024 | -0.03 pt | -0.54 pt | +1.8% | +0.12 pt | -0.03 pt |
| 8 November 2022 | US midterm elections 2022 | -0.07 pt | -0.30 pt | -2.6% | -0.42 pt | -0.09 pt |
| 3 November 2020 | US presidential election 2020 | -0.48 pt | -0.97 pt | -1.8% | +0.09 pt | -0.72 pt |
| 6 November 2018 | US midterm elections 2018 | +0.03 pt | -0.24 pt | +0.8% | -0.06 pt | +0.00 pt |
Data: OFR Financial Stress Index (U.S. Department of the Treasury) and FRED, Federal Reserve Bank of St. Louis. Past data, not a forecast. Not investment advice.
Each election has its own page with the full set of markets: the 2018 midterms, the 2022 midterms, the 2020 presidential election and the 2024 presidential election.
OFR Financial Stress Index, stock-valuation part: a fall (green, left) means calmer stock markets. Past data, not a forecast.
The 2026 midterms: what is at stake
On 3 November 2026, voters elect all 435 members of the House of Representatives, 35 senators and 36 governors. In mid-August, Republicans held 219 House seats and Democrats 212, with four vacancies; in the Senate, Republicans held 53 seats and Democrats 47. Democrats need a net gain of three House seats or four Senate seats to take control of either chamber, according to Schwab.
World tension stands at 36.5 out of 100 (Easing) on Riftrate today. The Coming up page lists the next elections and summits that could move it, and the United States page shows how much of US news is about armed violence this week.
How to read election-season swings
- Look at the size, not the headline. A 1% move on election night is common in an ordinary week of trading.
- Separate the vote from the economy. In 2022, inflation and fast interest-rate rises dominated markets all year; the midterms were one factor among many.
- Watch the dollar and Treasury yields. They react to what a new Congress could mean for spending and debt, often more clearly than stocks. See how elections move currencies.
Frequently asked questions
Do midterm elections affect the stock market?
Often, but not reliably. The S&P 500 rose in the year after 32 of the last 38 midterms and in the six months after each of the 13 midterms since 1974, yet statistical tests have not established a dependable midterm effect. Economy, rates and earnings usually matter more.
When are the 2026 midterm elections?
On Tuesday 3 November 2026. All 435 House seats, 35 Senate seats and 36 governorships are on the ballot.
Is a divided Congress good for stocks?
Many investors see divided government as positive because it limits large policy changes, and markets have often risen after midterms that split Congress. It can also bring standoffs over spending and the debt limit, which add volatility.
What happened to markets after the 2022 midterms?
The 2022 midterms gave Republicans a narrow House majority while Democrats kept the Senate. The table above shows what stock-market stress, the dollar and Treasury yields did in the following 5 and 20 sessions, from Riftrate’s events library.
Is this investment advice?
No. This page describes what happened in the past. Past data is not a forecast.