Monthly report · figures updated · By the Riftrate team
The month day by day
The index climbed through the first half of October and reached the Crisis zone in mid-month, before easing in the last ten days. The top stories of the days with the biggest rises show what drove it:
- 10 October 2026 (+6.2): Trump says Ukraine needs a new leader after diesel deal with Russia
- 11 October 2026 (+7.7): Riyadh airport strikes claimed by Yemen's Houthi day after deadliest attack in Saudi soil in ten years
- 12 October 2026 (+3.7): Trump says Russia and Ukraine agree to an 'energy ceasefire'
- 24 October 2026 (+2.8): France protests: Police say 1,10,000 marched in Paris
- 25 October 2026 (+2.8): Serbia’s Vucic concedes election defeat to student-led movement
The rise came mostly from the Gulf: the daily briefs of 11 to 15 October lead with Houthi strikes on Saudi Arabia and an attack on Yemen’s presidential palace in Aden. Talks on Ukraine between Kyiv, Washington and Moscow in the second half of the month coincided with the easing. Each date links to the daily brief of that day, with all its top stories and sources.
Where the tension was
Colour: the country’s latest level against its own history since 2017.
The countries where armed violence took a larger share of the news than in September:
| Country | September | October | Change |
|---|---|---|---|
| Saudi Arabia | 14.3% | 18.5% | +4.2 pts |
| Armenia | 2.9% | 6.6% | +3.6 pts |
| Sudan | 12.6% | 16.0% | +3.4 pts |
| Syria | 9.6% | 12.5% | +2.9 pts |
| Ethiopia | 12.2% | 14.9% | +2.7 pts |
The full ranking is on the countries page, with a page and a history since 2017 for each of the 74 countries.
What moved the index
The signals that changed most between September and October, on a scale from 0 (calm) to 100 (tense):
| Signal | Average | Change |
|---|---|---|
| Domestic unrest | 59 | +36.2 |
| Media tone | 56 | +33.1 |
| Escalation momentum | 45 | +16.8 |
| Geopolitical risk (GPR) | 77 | +13.5 |
| Economic coercion | 46 | -12.6 |
The methodology explains each signal. The October 2026 history page lists every daily reading.
Market risk
The three market risk indices measure armed violence only where the economy is exposed: oil and gas producers, the straits oil passes through, and the 30 largest economies (0 = calmest day since 2017, 100 = tensest).
| Market risk index | Average | Change |
|---|---|---|
| Energy supply risk | 85 | -2.6 |
| Oil shipping-route risk | 89 | +3.0 |
| Major economies risk | 51 | -11.9 |
See how wars affect oil prices for what Brent did after past crises. Past data, not a forecast. Not investment advice.
Frequently asked questions
How tense was the world in October 2026?
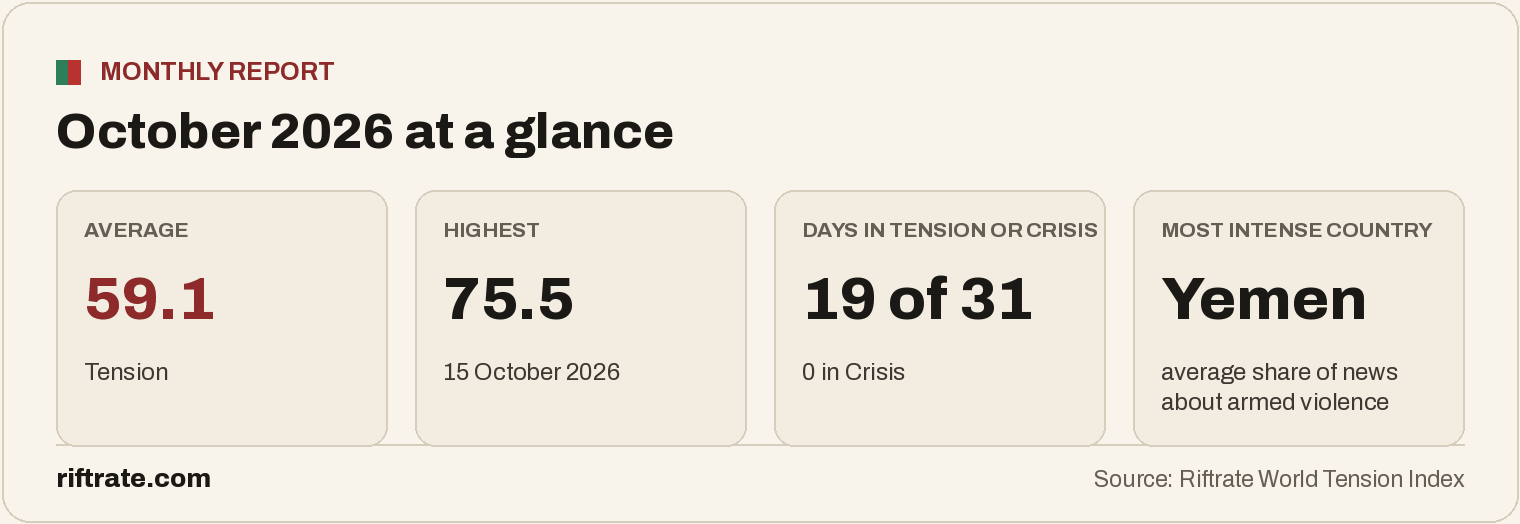
The Riftrate World Tension Index averaged 59.1 out of 100 (Tension), with a high of 75.5 on 15 October 2026 and a low of 37.8 on 31 October 2026.
Which country was the most tense in October 2026?
Yemen, where armed violence took the largest average share of the news among the 74 countries Riftrate tracks.
Where can I download the data?
Every daily reading since 2018 is free to download under CC BY 4.0 on the open data page.